

DMTN-214
Alert Distribution System Operator’s Manual#
Abstract
This is a practical collection of instructions, troubleshooting tips, and playbooks for managing and maintaining the Alert Distribution System.
Note
This is a practical collection of instructions, troubleshooting tips, and playbooks for managing and maintaining the Alert Distribution System.
This is a collection of instructions for how to operate the Alert Distribution System. An overview of the system is provided in DMTN-210 [Nelson and Smart, 2025] which is essential background reading for this document.
Basic Tools#
ArgoCD#
Argo CD [Argo CD: Declarative GitOps CD for Kubernetes, n.d.] is a tool for deploying software onto a Kubernetes cluster. Most changes to the Alert Distribution System are done through Argo.
There’s some official SQuARE-maintained documentation for Argo. This section tries to summarize what you’d need to know to work with the Alert Distribution System, but that thorough documentation is worth reading too.
Accessing Argo#
You will access the Alert Stream Broker installation at USDF using ArgoCD. There are two different environments, the dev environment at usdfdev-prompt-processing and the production environment at usdfprod-prompt-processing. Access to that installation is managed by the SQuARE team. You must have a SLAC windows account to log in.
When you go to the Argo UI for the first time, you’ll see a big mess of many “applications.” The primary one is named sasquatch but you may also be interested in the strimzi and postgres applications.
Applying Changes by Syncing#
Once you’re in an application, the main action you take is syncing. When you “sync” an application, you synchronize its state in Kubernetes with a “desired state” which is derived from Git.
You do this by clicking the big “SYNC” button at the top of the Argo UI. This brings up a daunting list of all the resources that will be synchronized. Usually you don’t want to make changes to the options here, although you might want to enable “prune.”
When “prune” is enabled, Argo will delete any orphaned resources that no longer seem to be desired. Without this option, they will linger around. They probably won’t cause harm, but this can be confusing. You can manually delete these resources if desired.
Additionally, some resources may not update properly if they depend on updates in other applications. These may require you to delete that specific resources and then re-deploy. Always test first on dev before making changes to prod.
The recommended deployment order for easy troubleshooting is:
Deploy the controller nodepool.
Deploy the kafka nodepool. Note: Both will be empty until Kafka is deployed
Deploy Alert Stream Kafka. Note: It may take some time for the deployment to create the services and pods
Deploy the schema registry
Deploy the ingress schema for the schema registry
Deploy other services
The strimzi schema operator is a separate application and is managed by Square.
For additional troubleshooting tips, go to Troubleshooting Troubleshooting
What is “Desired State” in Argo?#
The “desired state” of a service is based on whatever is currently in the main branch of the Phalanx repository.
Each application has a matching service in the Phalanx repo - for example, applications/sasquatch - which contains a Chart.yaml file, contains
a charts directory with several charts the broker depends on. At the top level, there are a number of values-*.yaml files which pertain to different
sasquatch deployments. The two relevant files for the alert stream broker are values-usdfdev-prompt-processing.yaml and values-usdfprod-prompt-processing.yaml
The Chart.yaml file lists Helm charts - and, very crucially, their versions - that define the actual configuration to be used.
The values- file(s) list the particular configuration values that should be plugged in to the Helm chart templates used by that service in that
specific environment.
The values.yaml file should only contain information that is agnostic to which environment the service is in.
Most of the sourced Helm charts are found in the charts directory of sasquatch, as the alert stream is now managed in the sasquatch deployment. The specific charts used are alert-brokers, alert-database, alert-stream-schema-sync, schema-registry, strimzi-kafka, and kafbat. These charts are described in more complete detail in DMTN-210. [Nelson and Smart, 2025]
Argo is sometimes a little bit delayed from the state of the Phalanx repository, perhaps by a few minutes. You might want to refresh a few times and make sure that the Git reference listed under “Current Sync Status” on the Argo UI for an application matches what you expect to apply.
1Password#
1Password is a password management tool. LSST IT uses it to distribute passwords, and the SQuARE team has adapted it for managing secrets stored in Kubernetes.
- It’s worth reading the documentation in Phalanx on this subject:
Managing the Alert Distribution System requires 1Password access. The LSST IT team can grant that access. Then, you’ll also need access to the “RSP-Vault” vault in 1Password, which can be granted by the SQuARE team.
The idea is that credentials are stored in a special 1Password vault with carefully formatted fields. Then you can run the phalanx vault-secrets-operator script to copy secrets from 1Password into Vault, which is a tool for encrypting secret data.
In the background, the Vault Secrets Operator copies secret data in Vault and puts it into Kubernetes secrets for use in Kubernetes applications.
This is used to manage the passwords for the Kafka users that can access the alert stream: their passwords are set in 1Password, copied into Vault with the script, and then automatically synchronized into Strimzi KafkaUsers (see also: DMTN-210 3.2.3.1: 1Password, Vault, and Passwords).
USDF Secrets Vault#
In addition to 1Password, secrets are also managed at USDF via the secrets vault. This can be used in conjunction with 1Password to update and alter secrets if using the vault-secrets-operator isn’t an option.
To access the vault, do the following steps at USDF:
module load vault

vault login -method=ldap username=YOUR-USERNAME
You will now have access to the vault. If you want to view credentials within the vault use:
vault kv get secret/rubin/usdf-prompt-processing/sasquatch
This will list all of the credentials related to the alert-stream-broker that are in the Sasquatch deployment. If you need to reconfigure any credentials, use the following command:
vault kv get -format=json -field=data secret/rubin/usdf-prompt-processing/sasquatch/SECRET-TO-CHANGE > pg.json
vault kv put secret/rubin/usdf-prompt-processing/sasquatch/SECRET-TO-CHANGE @<(cat pg.json)

OR

vault kv patch secret/rubin/usdf-prompt-processing-dev/sasquatch/ SECRET-TO-CHANGE=NEW-VALUE
Kafbat#
Kafbat [Kafbat: A Web UI for Apache Kafka, n.d.] is a web application that provides a UI dashboard for monitoring and managing the Alert Stream.
It can help with peeking at messages in the Kafka topics, viewing the broker’s configuration, monitoring the state of consumer groups, give some control over a specific consumers position in the alert stream, and more.
Kafbat can be accessed at https://usdfprod-prompt-processing.slac.stanford.edu/kafbat/ for the prod alert stream and https://usdfdev-prompt-processing.slac.stanford.edu/kafbat/ for the dev alert stream. You will need to use your SLAC credentials to log in.
You should see something like this:
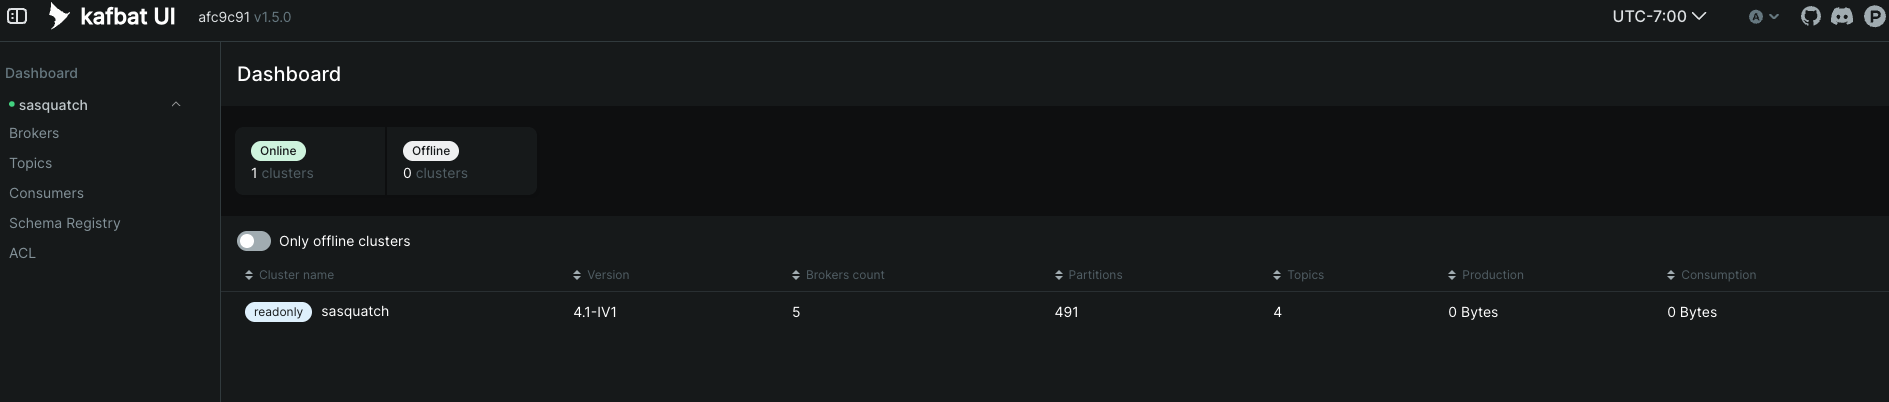
You have several different dashboards to look at. Navigating to the Brokers dashboard allows to you see the alert stream brokers, the number of partitions, replicas, disk usage, etc. This is useful for troubleshooting or monitoring the alert stream brokers and their health.
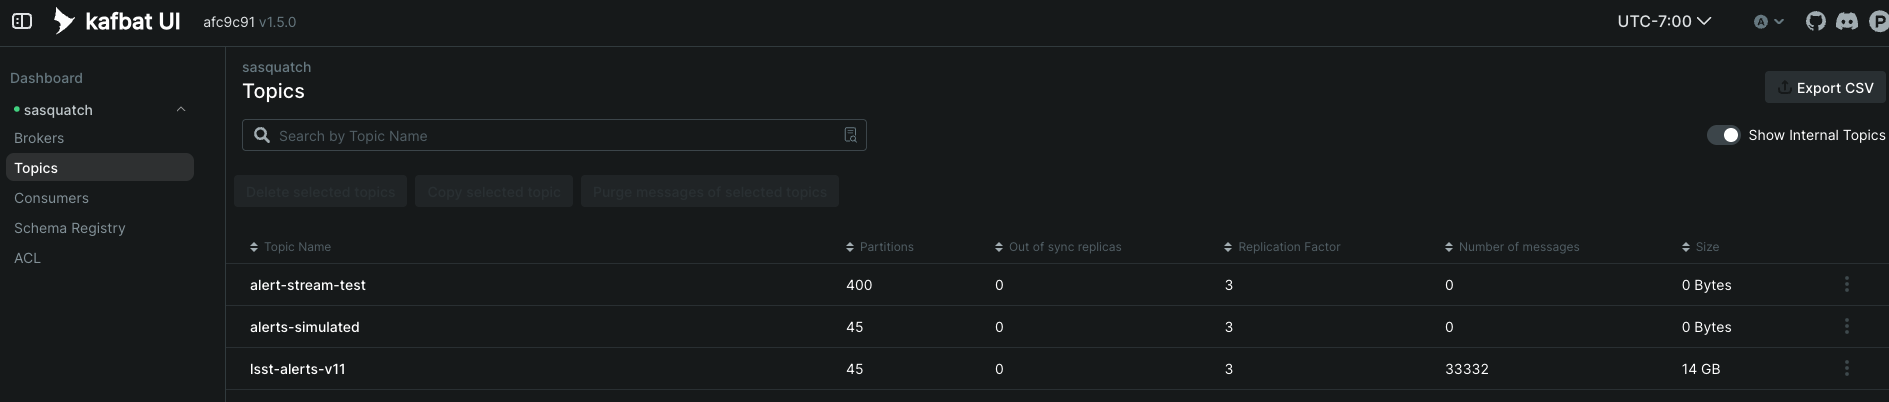
The next dashboard is the Topics dashboard. By clicking on a topic and the messages tab, you can see the deserialized messages in the topic. You can expand them by clicking the “+” sign in each row next to the “Value” column. For example:
You can also view individual active consumers reading from a specific topic, their lag, as well as which broker is acting as a coordinator.
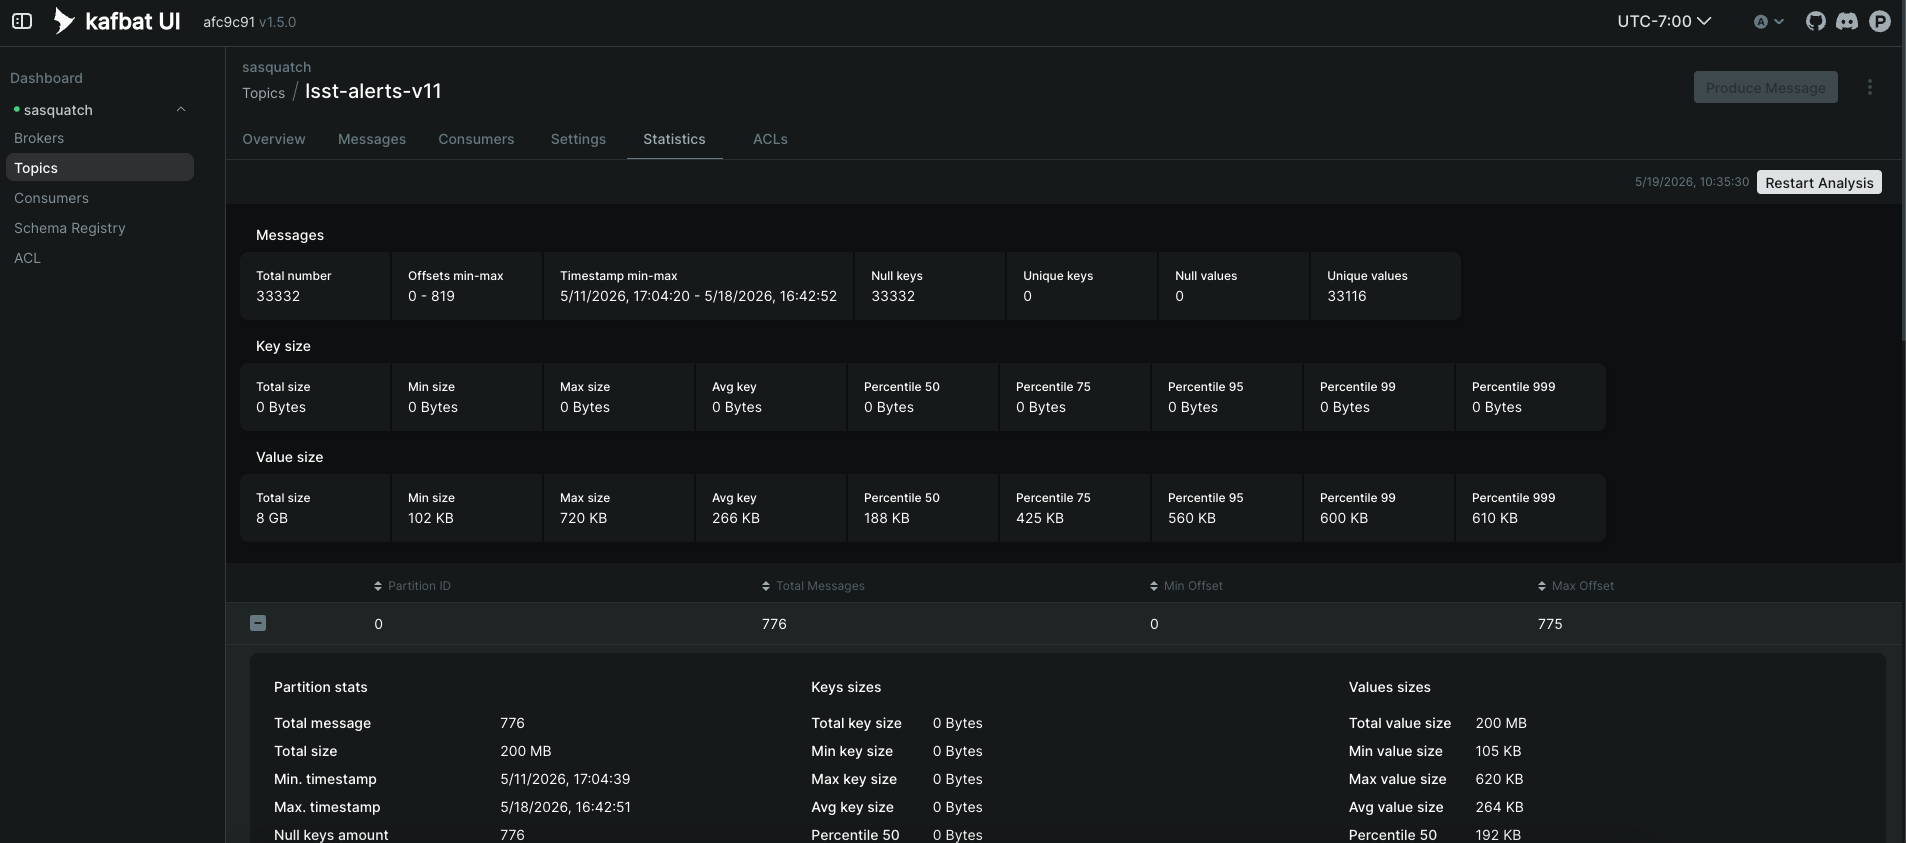
You can use the Statistic tab to view statistic on a subset of the alerts in that topic. This might take some time. Here you can see an example of the statistics panel, which looks at the Min and Max size of the alert packets, as well as the average packet size. You can also look at the statistics per partition.
Additionally, if you click the configurations tab, you can see which configuration values have been changed. These changes are PER topic, and override the global broker configurations.
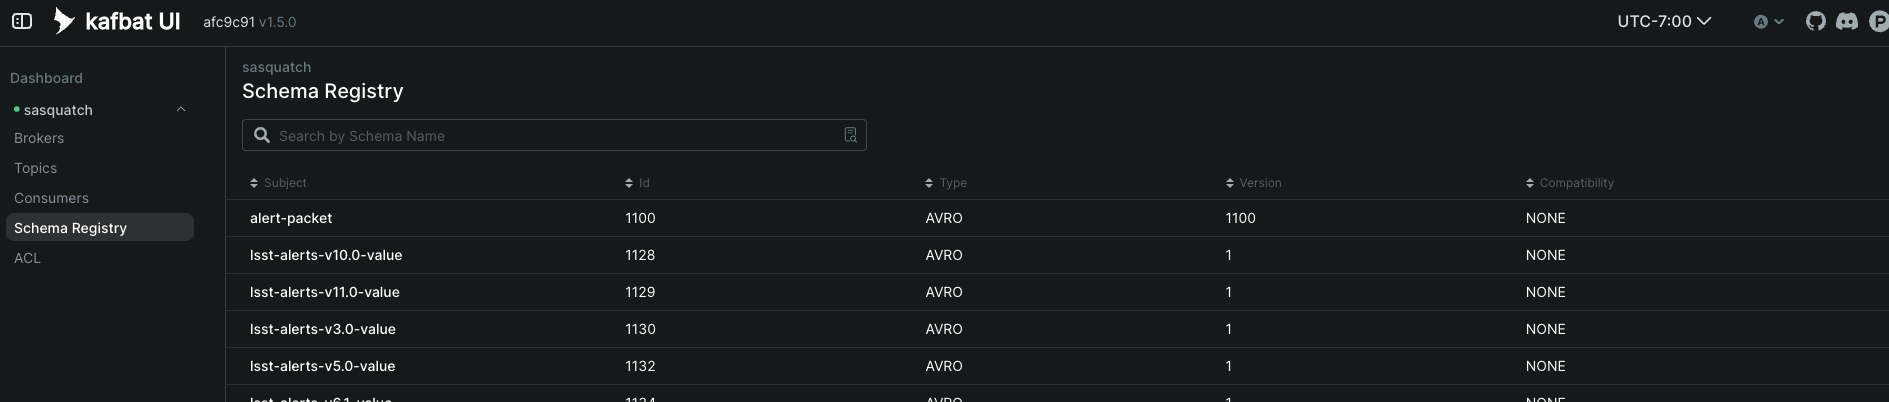
You can also look at the schema and its versions in the Schema Registry tab:
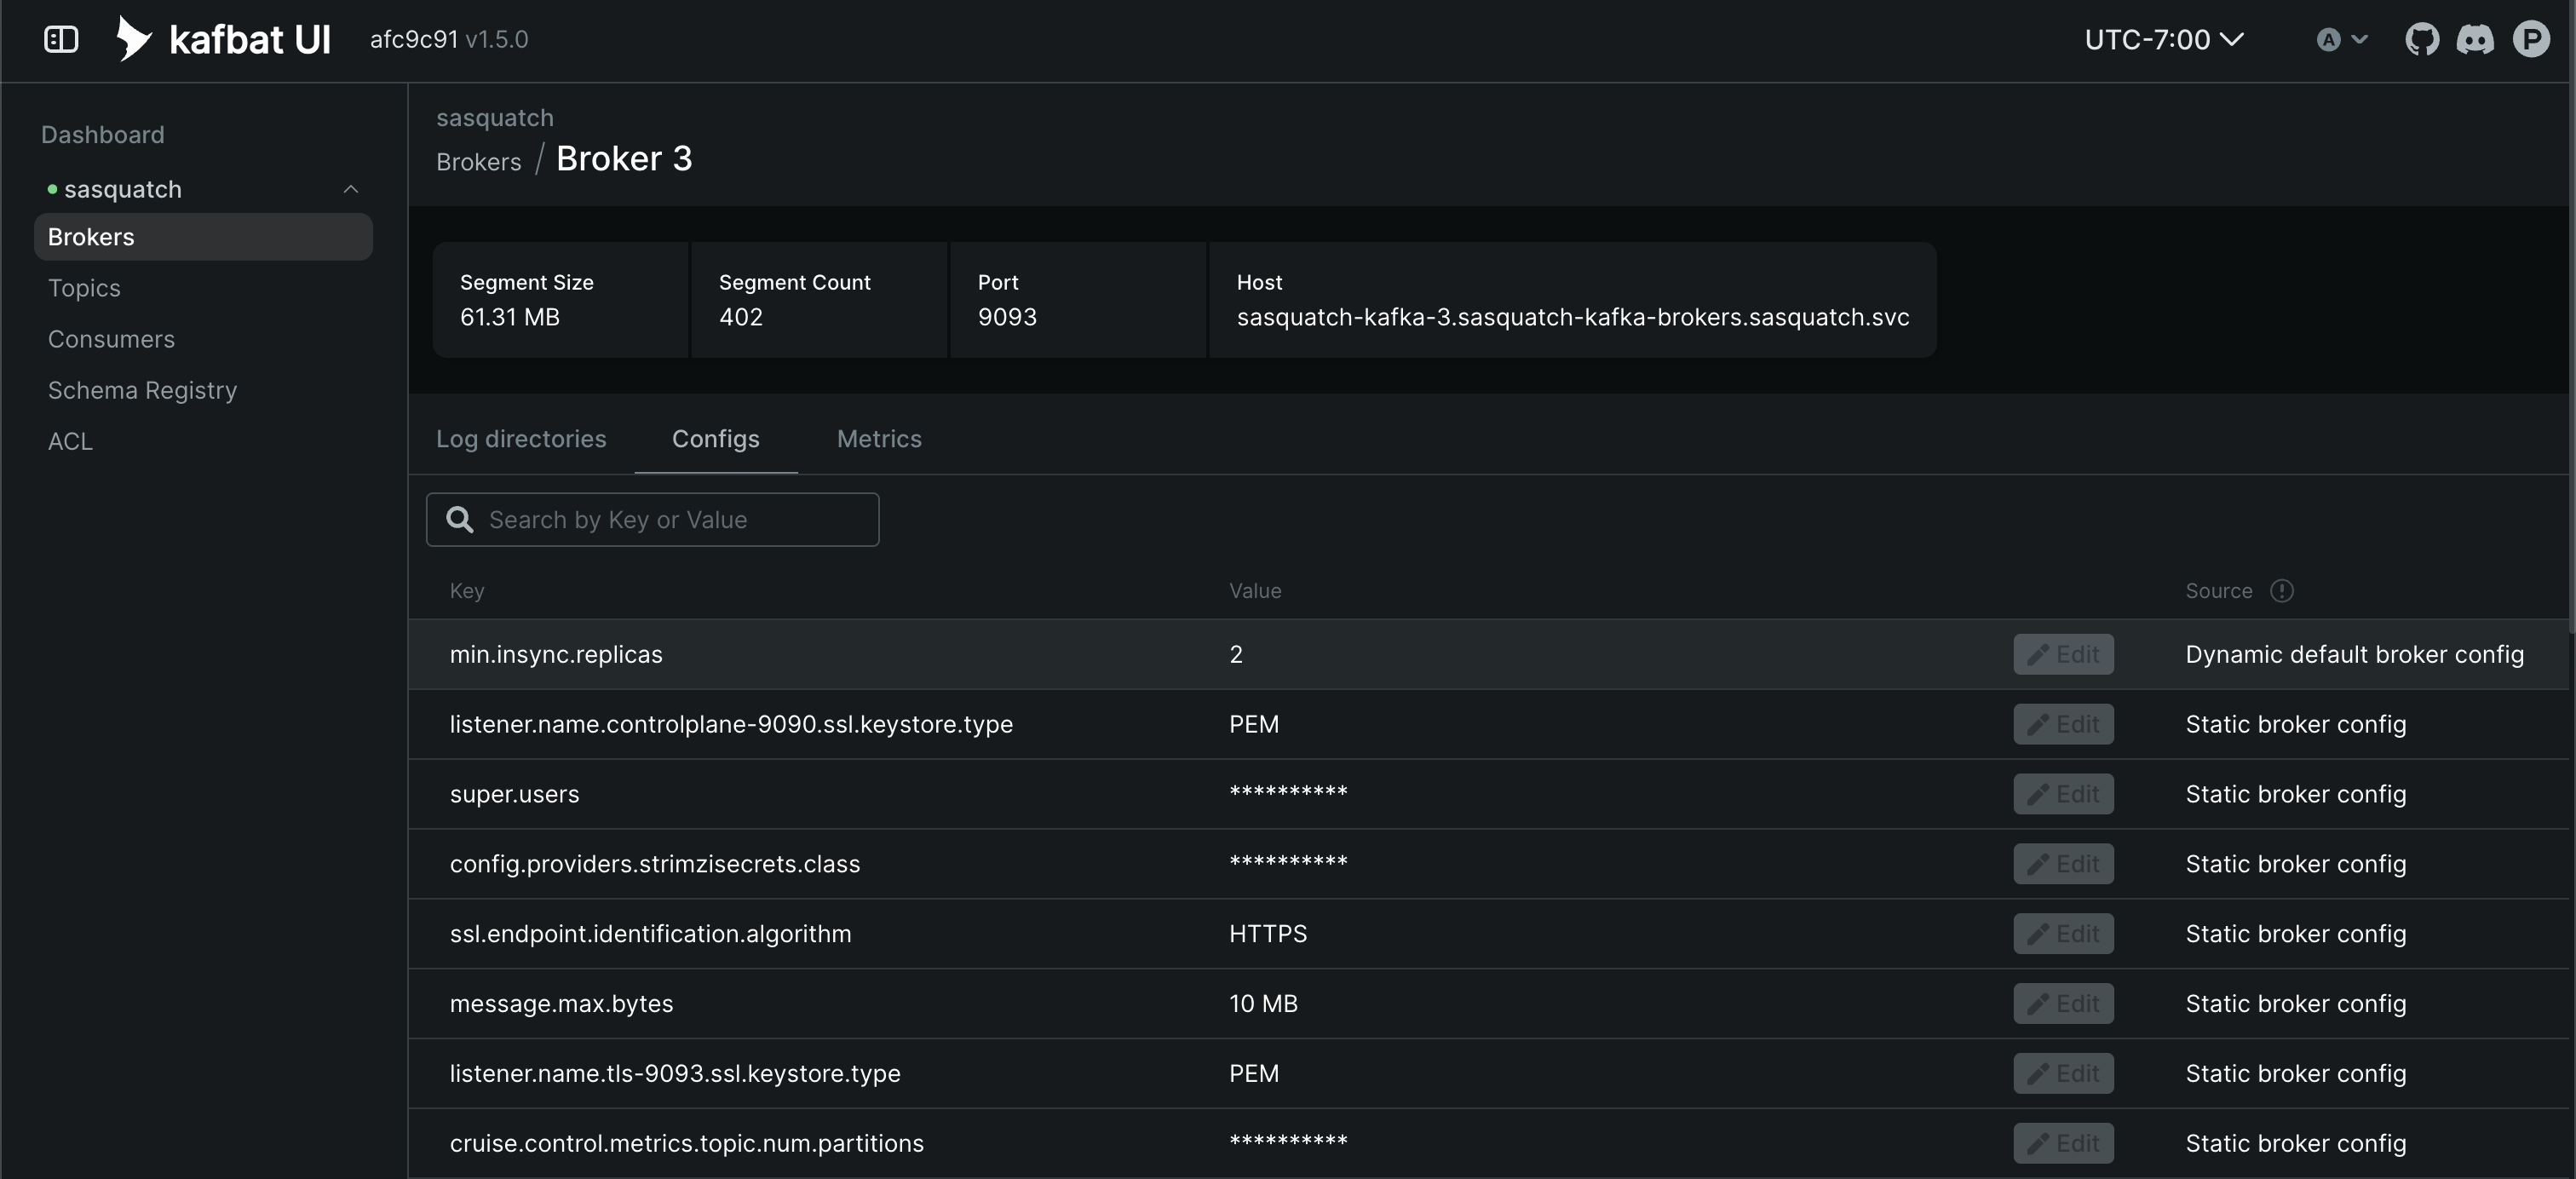
If you have made any changes to the Kafka broker’s configuration, you can check that on the Broker tab. It should look something like the following:
You can use this to confirm any changes you have made, though not all fields are visible.
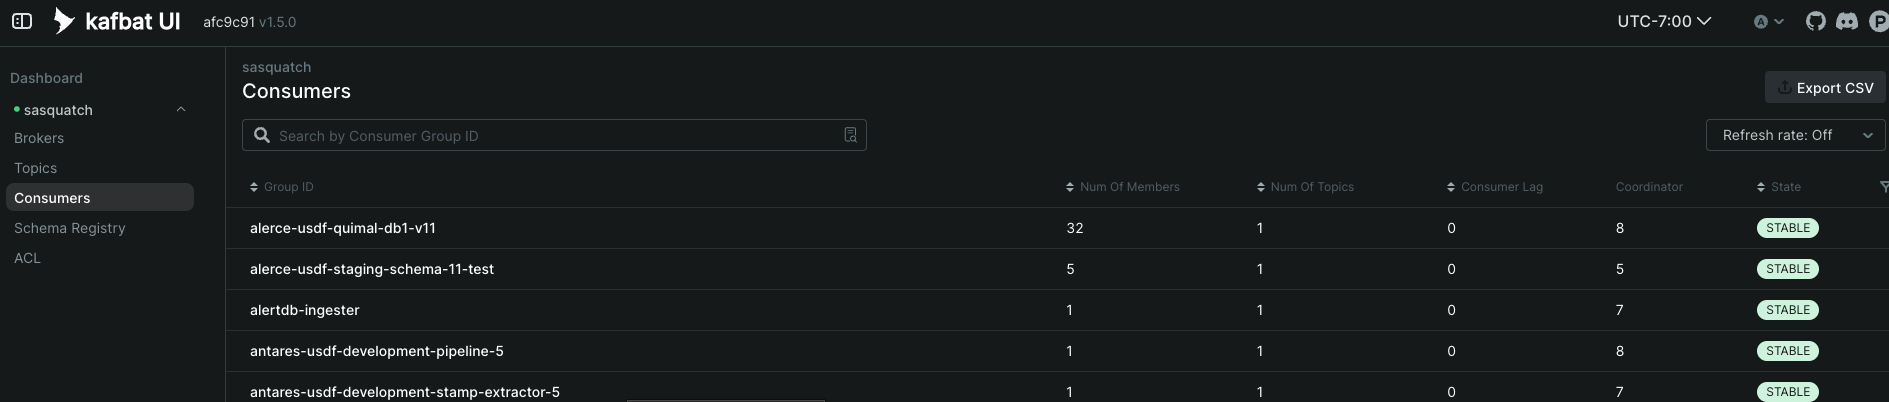
You can use the Consumer Groups tab to see the position of any consumers. For example, here we can see the Pitt-Google broker:
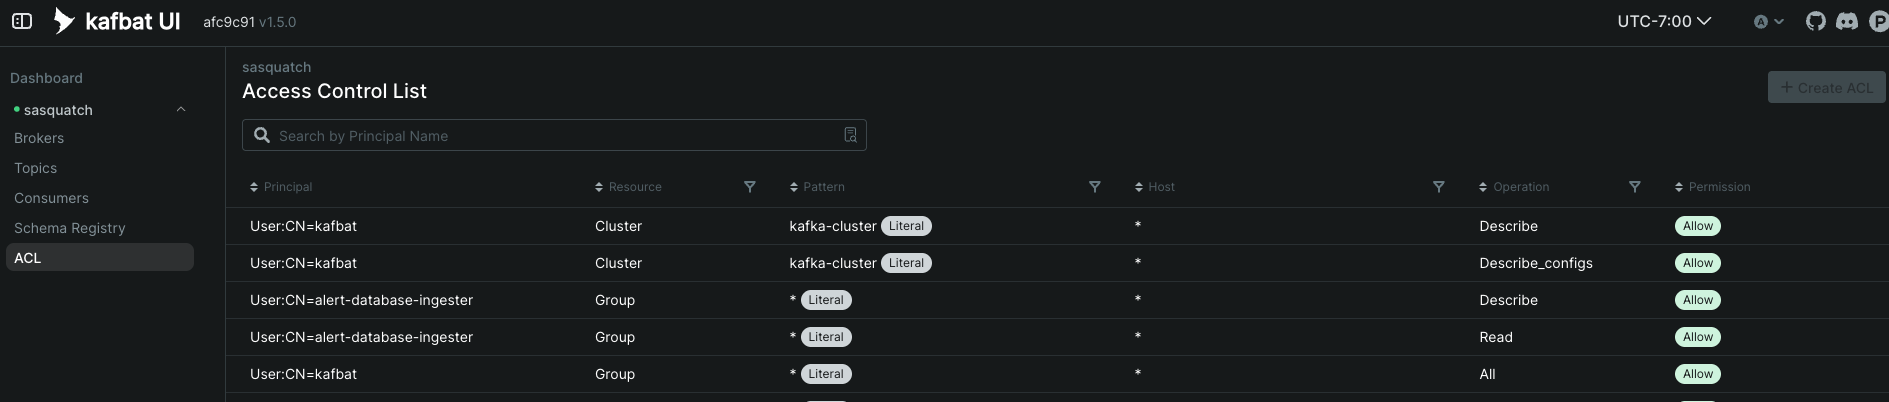
Additionally, you cn look at the Access Control List (ACL) via the ACL dashboard.
Kafbat has many more capabilities. See the official Kafbat documentation [Kafbat: A Web UI for Apache Kafka, n.d.] for more.
Tool Setup#
Secure Password Use#
Always use a password manager so that you are not leaving any credentials in the command line. If you are using 1password, you should use 1passwords command line tool so that you do not directly enter your credentials.
Getting kubectl Access for USDF#
Install
kubectl: https://kubernetes.io/docs/tasks/tools/Go to https://k8s.slac.stanford.edu/usdf-prompt-processing-dev or https://k8s.slac.stanford.edu/usdf-prompt-processing and login using your SLAC credentials.
Follow the instructions to gain set up kubectl.
You should now have kubectl access. Try kubectl get deployments --namespace sasquatch to verify. You should see output like this:
NAME READY UP-TO-DATE AVAILABLE AGE alert-database-ingester-1.0.0 1/1 1 1 18d kafbat 1/1 1 1 19d redpanda-console 1/1 1 1 100d sasquatch-cruise-control 1/1 1 1 106d sasquatch-entity-operator 1/1 1 1 106d sasquatch-kafka-exporter 1/1 1 1 78d sasquatch-schema-registry 1/1 1 1 106d
You want to see the database ingester as well as the schema registry. You can also try kubectl get pods --namespace sasquatch as well. It will look like this:
NAME READY STATUS RESTARTS AGE alert-database-ingester-1.0.0-696f6c6dfd-t2dkt 1/1 Running 0 11d alert-database-server-1.0.0-7ddd8b8884-v5tkj 1/1 Running 0 9d kafbat-64f7d6cfbd-btdxv 1/1 Running 0 14d redpanda-console-5857b5f449-jgjb4 1/1 Running 0 14d sasquatch-controller-0 1/1 Running 0 12d sasquatch-controller-1 1/1 Running 0 9d sasquatch-controller-2 1/1 Running 0 9d sasquatch-cruise-control-86ddd5f995-b57k2 1/1 Running 0 11d sasquatch-entity-operator-67dd678579-vbfkv 2/2 Running 0 9d sasquatch-kafka-3 1/1 Running 0 12d sasquatch-kafka-4 1/1 Running 0 13d sasquatch-kafka-5 1/1 Running 0 9d sasquatch-kafka-6 1/1 Running 0 11d sasquatch-kafka-7 1/1 Running 0 11d sasquatch-kafka-exporter-6c7f5b4987-w9wq2 1/1 Running 0 11d sasquatch-schema-registry-56f455c476-8wm8d 1/1 Running 0 11d
Here, the controllers 0-2 and the kafka instances 3-7 are what you want to see.
Kafbat Access#
Kafbat is an open-source web-based interface which we use to monitor and manage the alert stream, consumers, topics, and the alert archive. Kafbat is deployed via Phalanx.
Kafbat requires a login via SLAC, as well as configured permissions to access. MORE INFO HERE.
Retrieving Kafka superuser credentials#
The superuser has access to do anything. Be careful with these credentials! To find the credentials:
Log in to 1Password in the LSST IT account.
Go to the “RSP-Vault” vault.
Search for “alert-stream idfint kafka-admin”.
Retrieving development credentials#
This user only has limited permissions, mimicking those of a community broker.
Log in to 1Password in the LSST IT account.
Go to the “RSP-Vault” vault.
Search for “alert-stream idfint rubin-communitybroker-idfint”.
System Status#
Testing connectivity#
First, get the set of developer credentials (Retrieving development credentials).
Then, use one of the example consumer applications listed in sample_alert_info/examples. These will show whether you’re able to connect to the Kafka stream and receive sample alert packets, as well as whether you’re able to retrieve schemas from the Schema Registry.
Checking disk usage#
First, check how much disk is used by Kafka:
Open Kafbat, following the instructions in Kafbat Access.
Navigate to the brokers view.
You should see the amount of disk used by each broker in the right-most column under “size.”
Next, check how much is requested in the persistent volume claims used by the Kafka brokers:
Ensure you have kubectl access (Getting kubectl Access for USDF).
Run kubectl get pvc --namespace sasquatch. You should see output like this:
-> % kubectl get pvc -n sasquatch
  NAME                               STATUS   VOLUME                                     CAPACITY   ACCESS MODES   STORAGECLASS        VOLUMEATTRIBUTESCLASS   AGE
  data-0-alert-broker-controller-0   Bound    pvc-7ec41769-3643-40ef-8bcb-0aa0f377e093   20Gi       RWO            wekafs--sdf-k8s01   <unset>                 22h
  data-0-alert-broker-controller-1   Bound    pvc-a3102c54-2bb5-4f68-b4d0-921cce2cd57a   20Gi       RWO            wekafs--sdf-k8s01   <unset>                 22h
  data-0-alert-broker-controller-2   Bound    pvc-9c85d80c-b5a6-4d81-a95d-c2b734e9429e   20Gi       RWO            wekafs--sdf-k8s01   <unset>                 22h
  data-0-alert-broker-controller-3   Bound    pvc-3aa61263-dd82-4890-8bab-b038b154a845   20Gi       RWO            wekafs--sdf-k8s01   <unset>                 22h
  data-0-alert-broker-controller-4   Bound    pvc-f42e1031-903d-4923-8c6f-b4b91f6e6a0b   20Gi       RWO            wekafs--sdf-k8s01   <unset>                 22h
  data-0-alert-broker-controller-5   Bound    pvc-737b03a7-144e-4371-9c98-352870afe070   20Gi       RWO            wekafs--sdf-k8s01   <unset>                 22h
  data-0-alert-broker-kafka-10       Bound    pvc-ce20e21b-4e04-419f-bf03-fea6b0ff10ca   2500Gi     RWO            wekafs--sdf-k8s01   <unset>                 22h
  data-0-alert-broker-kafka-11       Bound    pvc-e52f5109-7fac-4a37-a505-2f0c624696e4   2500Gi     RWO            wekafs--sdf-k8s01   <unset>                 22h
  data-0-alert-broker-kafka-6        Bound    pvc-7b59f3ad-e6d3-4063-87ae-b2b2732c93af   2500Gi     RWO            wekafs--sdf-k8s01   <unset>                 22h
  data-0-alert-broker-kafka-7        Bound    pvc-1d9bdef8-e524-41ad-8cf0-12db3c9ea101   2500Gi     RWO            wekafs--sdf-k8s01   <unset>                 22h
  data-0-alert-broker-kafka-8        Bound    pvc-be557069-a4bb-4def-abf1-5a386535b616   2500Gi     RWO            wekafs--sdf-k8s01   <unset>                 22h
  data-0-alert-broker-kafka-9        Bound    pvc-218f52f6-b7b2-4948-97cc-2792fd1e8dfb   2500Gi     RWO            wekafs--sdf-k8s01   <unset>                 22h
Checking consumer group status#
Open Kafbat.
Navigate to the consumer group view
There should be an entry for each consumer group that is connected or has connected recently.
The “Coordinator” column indicates which of the three Kafka broker nodes is used for coordinating the group’s partition ownership.
The “Members” column indicates the number of currently-active processes which are consuming data.
The “Lag” column indicates how many messages are unread by the consumer group.
Checking logs on Argo#
Logs are also available in Argo. To look at the logs, pick the specific tile you would like to view and click LOGS. These can be viewed in the browser or downloaded. Tiles which have logs are Pods, Deployments, Jobs, and ReplicaSets.
In the browser, you can view the logs from the previous container restarts. You can also use keywords such as DEBUG or ERROR to search for specific messages within the logs via the search bar.
Checking Alert Stream status on Grafana#
The alert stream status, as well as metrics on alert stream consumers, topics, lag, and throughput can be found on the alert stream grafana dashboard.
In addition to the dashboards, grafana will send notifications to the slack channel alert-stream-notifications when there are issues with pieces of the alert stream and the applications it depends on. The slack channel is currently private, and you must ask someone with access to add you.
Alert Archive#
The alert archive system consists of the alert archive server and alert archive ingester. The ingester and server are both setup within the alert stream system using phalanx under the alert database charts.
Alert Archive Server#
Accessing the Alert Archive is now handled by Herald and through the Rubin Science Platform (URL TBD).
For information on the retired alert archive server, reference the documentation below.
The alert archive server handles HTTP requests to the alert archive and returns the requests alert packet via a FastAPI application. See the alert archive server documentation for details on how to make requests.
Alert Archive Ingester#
The alert archive ingester reads alerts from a specified Kafka topic and writes the alerts and their schema to the alert archive.
Once active, the alert archive ingester will always be listening to the specified topic and will write any new alerts to the alert archive.
Troubleshooting#
The alert archive ingester requires a region to be set even though we are not using AWS infrastructure. If it is not set or set to the wrong region, you will see the following error:
botocore.exceptions.ClientError: An error occurred (SignatureDoesNotMatch) when calling the PutObject operation: None
Currently we are using us-east-1 as the default region.
Accessing the archive manually at USDF#
To access the archive at USDF, you need to load in the AWS credentials into your environment. This requires vault access. If you do not have vault access see usdf-secrets-vault. Once you have access to the AWS credentials loaded into your environment, you have several options for interacting with the archive.
The MinIO module can be set up and used to access the alert archive.
module load mc

mc alias set <ALIAS> <YOUR-S3-ENDPOINT> <YOUR-ACCESS-KEY> <YOUR-SECRET-KEY>
From here you should be able to make changes to the archive using the mc command. For a full list of commands, see the MinIo documentation
To use s3 and s3api, you need to have the above AWS credentials loaded into your environment.
alias s3="singularity exec /sdf/sw/s3/aws-cli_latest.sif aws --endpoint-url https://sdfembs3.sdf.slac.stanford.edu/ s3"

alias s3api='singularity exec /sdf/sw/s3/aws-cli_latest.sif aws --endpoint-url https://sdfembs3.sdf.slac.stanford.edu/ s3api'
Administration#
Sharing passwords#
Log in to 1Password in the LSST IT account.
Go to the “RSP-Vault” vault.
Search for the username of the account you want to share.
Click on the 3-dot menu in the top right and choose “Share…”:
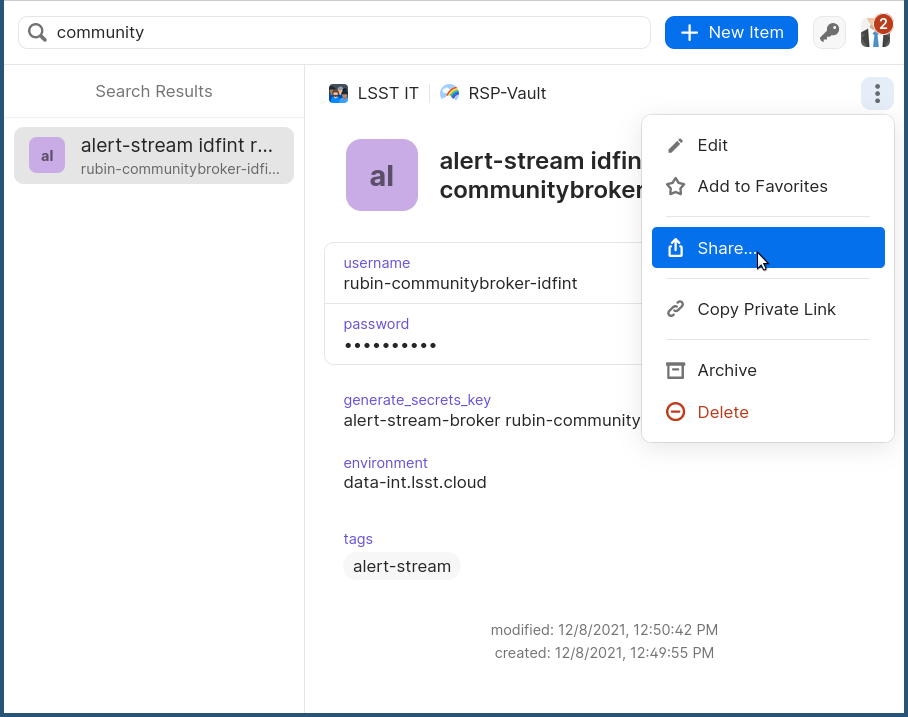
This will open a new browser window for a sharing link.
Set the duration and availability as desired, and click “Get Link to Share”:
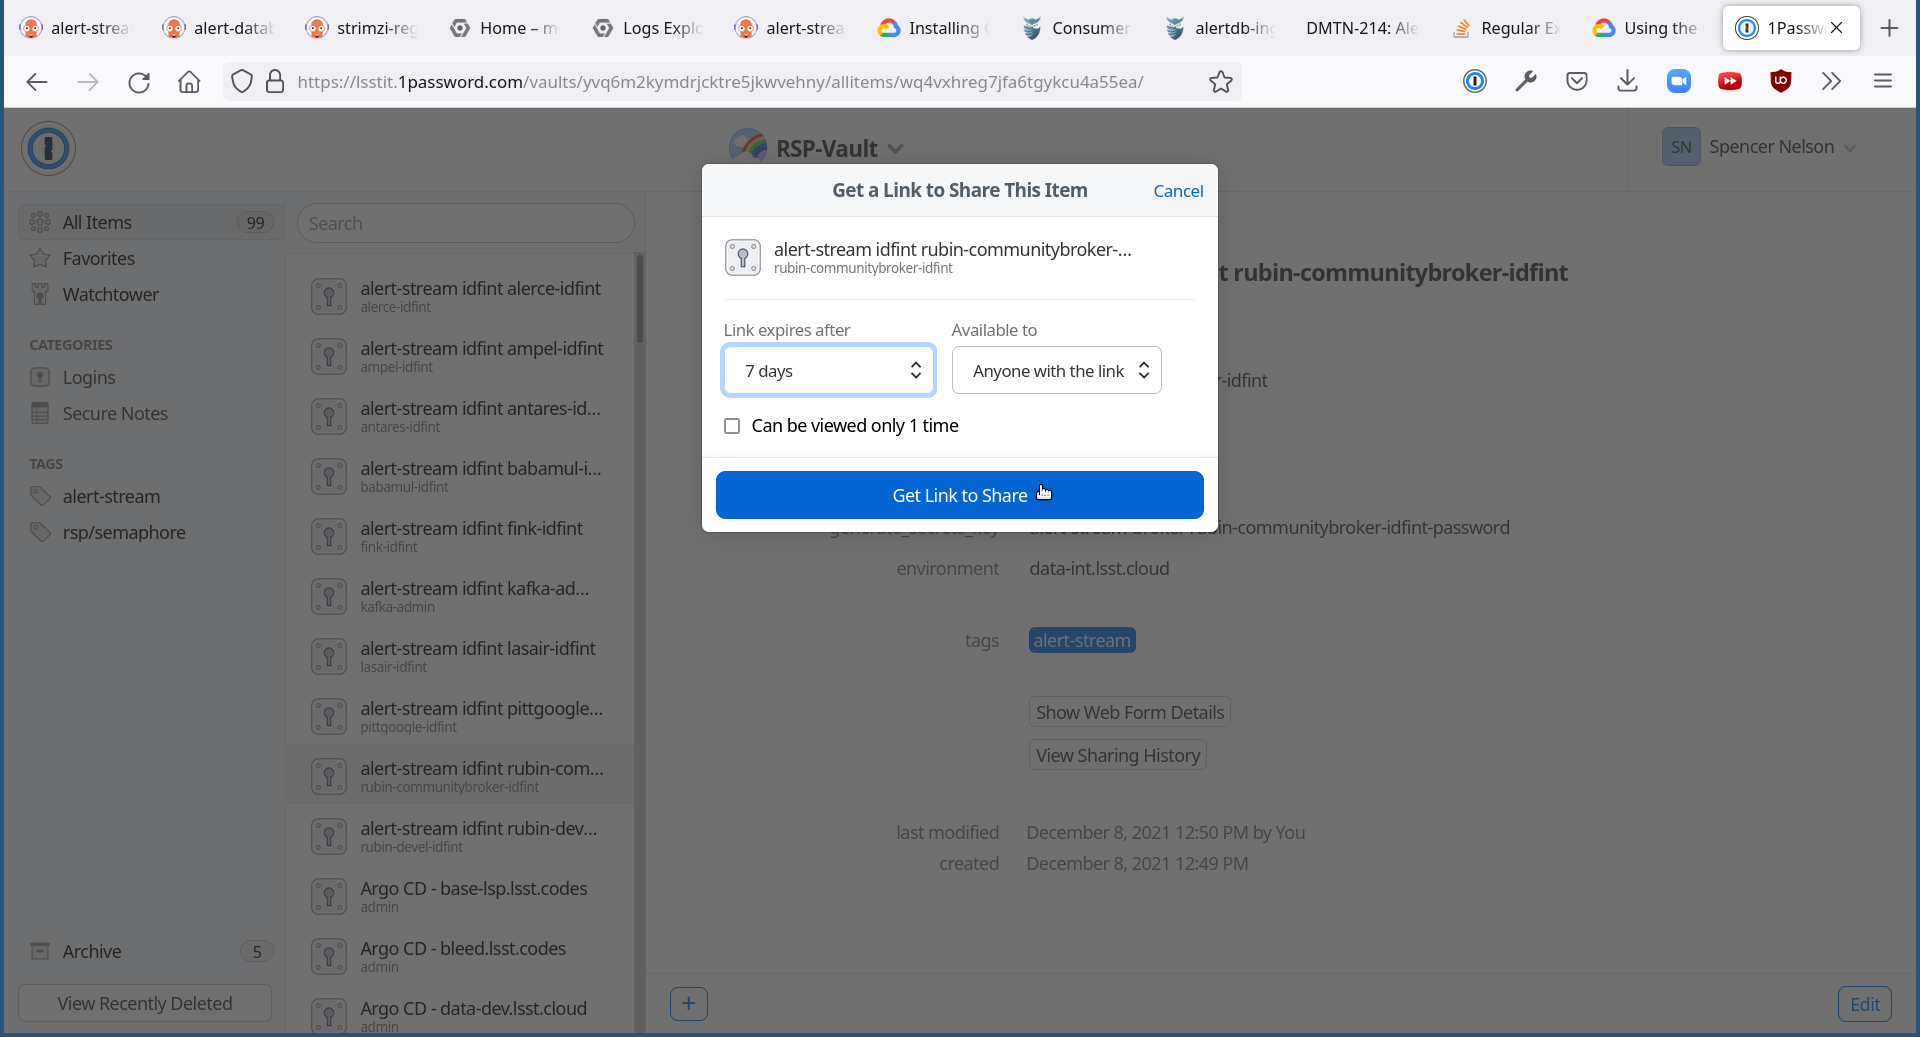
Share the link as you see fit.
Shared links can also be revoked; see 1Password Documentation for more.
Changing passwords#
Log in to 1Password in the LSST IT account.
Go to the “RSP-Vault” vault.
Search for the username of the account you want to modify.
Click on the password field. Generate a new password and set it, and save your changes.
Follow the instructions in Phalanx: Updating a secret stored in 1Password and VaultSecret.
Then verify that the change was successful by checking it in Argo.
Log in to Argo (see also Accessing Argo).
Navigate to the “sasquatch” application.
In the “filters” on the left side, search for your targeted username in the “Name” field. You should see a filtered set of resources now.
Click on the “secret” resource and check that it has an “updated” timestamp that is after you made your changes. If not, delete the “Secret” resource; it will be automatically recreated quickly. Once recreated, the user’s password will be updated automatically.
If this seems to be having trouble, consider checking:
the Vault Secrets Operator logs to make sure it is updating secrets correctly
the Strimzi Entity Operator logs to make sure they are updating user accounts correctly
the Kafka broker logs to make sure it’s healthy
if you are still having issues, you can manually change the secret by following the instructions in usdf-secrets-vault
Adding a new user account#
First, generate new credentials for the user:
Log in to 1Password in the LSST IT account.
Go to the “RSP-Vault” vault.
Create a new secret.
Name it “alert-stream usdf <username>”.
Set the “Username” field to <username>.
Set the “Password” field to something autogenerated.
Add a field named “generate_secrets_key”. Set its value to “alert-stream-broker <username>-password”
Add a field named “environment”. Set its value to “data-int.lsst.cloud”
If you’re running in a different environment than the USDF integration environment, replaced “usdf” and “data-int.lsst.cloud” with appropriate values.
Sync the secret into Vault following the instructions in Phalanx documentation.
Second, add the user to the configuration for the cluster:
Make a change to github.com/lsst-sqre/phalanx’s applications/sasquatch/values-usdfprod-prompt-processing.yaml file. * Add the new user to the list of users under
alert-stream-broker.users: https://github.com/lsst-sqre/phalanx/blob/d3cb9b79e7fa76117cdb9039b1215a53bb5fa526/applications/sasquatch/values-usdfprod-prompt-processing.yaml#L22 * If it is a community broker, make sure the new user is subscribed to *communityReadonlyTopics. * All topics available to the community brokers are listed undercommunityReadonlyTopics: https://github.com/lsst-sqre/phalanx/blob/d3cb9b79e7fa76117cdb9039b1215a53bb5fa526/applications/sasquatch/values-usdfprod-prompt-processing.yaml#L18 * If running in a different environment than the USDF integration environment, modify the appropriate config file, not values-usdfdev-prompt-processing.yaml.Make a pull request with your changes, and make sure it passes automated checks, and get it reviewed.
Merge your PR. Wait a few minutes for Argo to pickup the change.
Log in to Argo CD.
Navigate to the ‘sasquatch’ application.
Click “sync” and leave all the defaults to sync your changes, creating the new user.
Verify that the new KafkaUser was created by using the filters on the left side to search for the new username.
Verify that the user was added to Kafka by using Kafbat and going to the “Access Control List” (ACL) section (see Kafbat Access).
Optionally verify that access works using a method similar to that in Testing connectivity.
Removing a user account#
Delete the user from the list in github.com/lsst-sqre/phalanx’s
applications/sasquatch/values-usdfprod-prompt-processing.yamlfile.Make a pull request with this change, and make sure it passes automated checks, and get it reviewed.
Merge your PR.
Delete the user’s credentials from 1Password in the RSP-Vault vault of the LSST IT account. You can find the credentials by searching by username.
Log in to Argo CD.
Navigate to the ‘sasquatch’ application.
Click “sync”. Click the “prune” checkbox to prune out the defunct user. Apply the sync.
Verify that the user was removed from Kafka by using Kafbat and going to the “Access Control List” section (see Kafbat Access). The user shouldn’t be in the ACLs anymore.
Granting users read-only access to a new topic#
Make a change to github.com/lsst-sqre/phalanx’s
applications/sasquatch/values-usdfprod-prompt-processing.yamlfile. In the list of topics undercommunityReadonlyTopics, add the new topic. This will give all users who are assigned to *communityReadonlyTopics access to the new topic.Make a pull request with your changes, and make sure it passes automated checks, and get it reviewed.
Merge your PR.
Log in to Argo CD.
Navigate to the ‘sasquatch’ application.
Click “sync” and leave all the defaults to sync your changes, modifying access.
Verify that the change worked by using Kafbat and going to the “Access Control List” section (see Kafbat Access). There should be matching permissions with Resource=TOPIC, Permission=ALLOW, and Principal being the users who were granted access.
Adding a new Kafka topic#
- The kafka-topics are managed in applications/sasquatch/charts/alert-brokers/templates
and via the alert-brokers.topics section.
Add the new desired topic to the relevant prompt-processing yaml. Always test first on the dev version before updating prod. Follow and existing topic that is currently being use to produce alerts. This is an example of the desired topic setup for topics which will be read by the consumers.
topics:
- name: lsst-alerts-v11
  partitions: 45
  replicas: 3
  bytesRetained: "300000000000"
  millisecondsRetained: "2629740000"
Make a pull request with your changes to
sasquatch/values-usdf(prod/dev)-prompt-processing.yaml, and make sure it passes automated checks, and get it reviewed. Merge your PR.Wait a few minutes (perhaps 2) for Argo to pick up the change to Phalanx.
Log in to Argo CD.
Navigate to the ‘sasquatch’ application.
Click ‘sync’ and leave all the defaults to sync your changes, creating the new topic.
If this is a new topic for users to read, make sure you have coordinated with Prompt Processing so that they have updated their endpoints, and that you have the relevant schema changes ready and in the schema registry.
Verify that the change worked by using Kafbat and going to the “Topics” section (see Kafbat Access). There should be a new topic created.
To let users read from the topic, see Granting users read-only access to a new topic.
Making Changes#
Deploying a change with Argo#
In general, to make any change with ArgoCD, you update Helm charts, update Phalanx, and then “sync” the alert-stream-application:
Make desired changes to Helm charts, if required, in sasquatch/charts. Note that any changes to Helm charts always require the version to be updated.
Merge your Helm chart changes.
Update the applications/sasquatch/Chart.yaml file to reference the new version number of the chart you have updated, if you made any Helm chart changes.
Update the
applications/sasquatch/values-usdfprod-prompt-processing.yamlfile to pass in any new template parameters, or make modifications to existing ones.Merge your Phalanx changes.
Wait a few minutes (perhaps 10) for Argo to pick up the change to Phalanx.
Log in to Argo CD at https://usdfdev-prompt-processing.slac.stanford.edu/argo-cd/applications/argocd/.
Navigate to the ‘sasquatch’ application.
Click ‘sync’ to synchronize your changes.
Updating the Kafka version#
The Kafka version is set in the sasquatch/charts/strimzi-kafka/templates/kafka/yaml file. This chart is managed by Square, and is what deploys our specific Kafka configuration.
The dev and prod version of the Alert Stream are configured via the strimzi-kafka fields in applications/sasquatch/values-usdfdev-prompt-processing.yaml.
If updating the Kafka version, update the strimzi-kafka.kafka.version field. To update the version of Kafka used, update applications/sasquatch/values-usdfdev-prompt-processing.yaml.
Under strimzi-kafka, then under kafka, add a value: version: <whatever you want>.
logMessageFormatVersion and interBrokerProtocolVersion are now set automatically and do not need to be manually set.
See Strimzi documentation on Kafka Versions to check if there are any other parameters which need updating when updating the Kafka version.
Then, follow the steps in Deploying a change with Argo to apply these changes.
See also: the Strimzi Documentation’s “9.5: Upgading Kafka”.
Updating the Strimzi version#
The current version of Strimzi used by the Alert Broker is updated and managed by Square. Any changes to the version should be discussed with them. If any specific changes are required, you probably want to read the Strimzi Documentation’s “9. Upgrading Strimzi”.
The Strimzi version version is governed by the version referenced in github.com/lsst-sqre/phalanx’s applications/strimzi/Chart.yaml file.
Then, apply the change in a way similar to that described in Deploying a change with Argo. Note though that you’ll be synchronizing the ‘strimzi’ application in Argo, not the ‘sasquatch’ application in Argo.
Resizing Kafka broker disk storage#
Some reference reading:
DMTN-210’s section 3.2.1.3: Storage.
Change the strimzi-kafka.broker.storage.size value in applications/sasquatch/values-usdfdev-prompt-processing.yaml in github.com/lsst-sqre/phalanx.
This is the amount of disk space per broker instance.
Apply the change, as described in Deploying a change with Argo.
This may take a little while to apply, since it is handled through the asynchronous Kafka operator, which reconciles storage size every few minutes. When it starts reconciling, it rolls the change out gradually across the Kafka cluster to maintain availability.
Note that storage sizes can only be increased, never decreased.
Updating the alert schema#
For background, you might want to read DMTN-210’s section 3.4.4: Schema Synchronization Job.
The high-level steps are to:
Commit your changes in the lsst/alert_packet repository. Follow all instructions in the README at https://github.com/lsst/alert_packet.
A new lsstdm/lsst_alert_packet container will be automatically created from the branch. Use this for testing on dev.
- Change the alert schema image version in
values-usdfprod-prompt-processing.yamlby changing alert-stream-schema-sync.schemaSync.image.tagwith the new image tag.
Re-sync the alert stream and you should see the newest schema in the schema registry in Kafbat.
- Once you confirm that the changes work, publish a new lsst-alert-packet Python package version. Change the image tag to
the newly published tag and merge the changes.
Schema changes also require new associated topics. Please follow all instructions in the alert_packet repository and give Prompt Processing plenty of time to swap over to the new topic.
Making a new alert schema#
The creation of new alert schemas is now automated. Follow the guide in github.com/lsst/alert_packet.
Creating a container which loads the schema#
When you are satisfied with your changes, push them and open a PR.
As long as your github branch starts with “tickets/” or is tagged, this will automatically kick off the “build_sync_container” GitHub Actions job, which will create a Docker container holding the alert schema.
The container will be named lsstdm/lsst_alert_packet:<tag-or-branch-name>; slashes are replaced with dashes in the tag-or-branch-name spot.
For example, if you’re working on a branch named tickets/DM-34567, then the container will be created and pushed to lsstdm/lsst_alert_packet:tickets-DM-34567.
You can use this ticket-number-based container tag while doing development, but once you’re sure of things, merge the PR and then tag a release. The release tag can be the version of the alert schema (for example “4.1”) if you like - it doesn’t really matter what value you pick; there are so many version numbers flying around with alert schemas that it’s going to be hard to find any scheme which is ideal.
To confirm that your container is working, you can run the container locally. For example, for the “w.2022.04” tag:
-> % docker run --rm lsstdm/lsst_alert_packet:w.2022.04 'syncLatestSchemaToRegistry.py --help'
usage: syncLatestSchemaToRegistry.py [-h]
                                     [--schema-registry-url SCHEMA_REGISTRY_URL]
                                     [--subject SUBJECT]

optional arguments:
  -h, --help            show this help message and exit
  --schema-registry-url SCHEMA_REGISTRY_URL
                        URL of a Schema Registry service
  --subject SUBJECT     Schema Registry subject name to use
Loading the new schema into the schema registry#
Loading in new schemas to the registry now loads all schemas in at once. This is done via the schemaSync job which runs whenever ArgoCD is synced. The dependent python script lives in alert_packet/python/lsst/alert/packet/bin/syncAllSchemasToRegistry.py. If changes are made to the schema sync python script, you must then update the docker image used in values-usdfprod-prompt-processing.yaml file.
Apply these changes as described in Deploying a change with Argo. The result should be that a new schema is added to the schema registry.
Once the change is deployed, the job that loads the schema will start. You can monitor it in the Argo UI by looking for the Job named ‘sync-schema-job’. If you ever need to rebuild the schema registry, simply press sync again. This will delete and completely rebuild the schema registry, preserving the assigned schema numbers for each schema version.
You can confirm it worked by using Kafbat (see Kafbat Access) and using its UI for looking at the schema registry’s contents.
The alert stream simulator gets its version of the alert packet schema from the lsst-alert-packet Python package.
The version of this package that it uses is set in setup.py of github.com/lsst-dm/alert-stream-simulator.
You’ll need to publish a new version of the lsst-alert-packet Python package in order to get a new version in alert-stream-simulator.
The new version of the package needs to be published to PyPI, the Python Package Index: https://pypi.org/project/lsst-alert-packet/. It can be managed by a user named ‘lsst-alert-packet-admin’, which has credentials stored in 1Password in the RSP-Vault vault. Use 1Password to get the credentials for that user. The DM user ‘rubinlsstdm’ is also a maintainer for this package.
We use a Github action to automatically assign version numbers and upload to PyPI. New versions are created for each weekly and for Github tags, so if a version is needed prior to a weekly it would be appropriate to create a new tag.
Updating the Alert Stream Simulator package#
The alert stream simulator needs to use the new version of the lsst-alert-packet version which you published to PyPI.
Second, the chart which runs the simulator needs to be updated to use the right ID of the schema in the schema registry.
The version of lsst-alert-packet is set in the setup.py file of github.com/lsst-dm/alert-stream-simulator.
Update this to include the newly-published Python package.
Once you have made and merged a PR to this, tag a new release of the alert stream simulator using git tag. When your tag has been pushed to the alert stream simulator GitHub repository, an automated build will create a container (in a manner almost exactly the same as you saw for lsst/alert_packet).
You can use docker run to verify that this worked.
For example, for version v1.2.1:
-> % docker run --rm lsstdm/alert-stream-simulator:v1.2.1 'rubin-alert-sim -h'
usage: rubin-alert-sim [-h] [-v] [-d]
                       {create-stream,play-stream,print-stream} ...

optional arguments:
  -h, --help            show this help message and exit
  -v, --verbose         enable info-level logging (default: False)
  -d, --debug           enable debug-level logging (default: False)

subcommands:
  {create-stream,play-stream,print-stream}
    create-stream       create a stream dataset to be run through the
                        simulation.
    play-stream         play back a stream that has already been created
    print-stream        print the size of messages in the stream in real time
Schema Registry Ids#
Schema ids are determined by the schema version number. Ids are assigned using the major number and assigning the minor number to a 00 format. For example, schema version 7.1 will be schema id number 701. Schema 13.12 would be schema 1312 and so forth.
These ids are generated automatically from the schemas within lsst/alert/packet/schema in github.com/lsst/alert_packet, and are assigned to the registry in syncAllSchemasToRegistry.py. Corresponding ids are assigned to alerts in packageAlerts.py.
Kafbat is the easiest way to view current schema ids and the schema id used for specific alerts.
Run Kafbat (see Kafbat Access) and then navigate to the schema registry. There should be a drop-down with different versions. You probably want the latest version, which might already be the one being displayed. Select the desired version.
At the top of the screen, you should see the “Schema ID” of the schema you have selected.
DNS Records#
Provisioning DNS records#
The alert stream and the alert schema registry both need static IP’s assigned. If for some reason
In the current gcloud setup, this must be done through Square. If you cannot use the existing static IPs, you must request that you are assigned six for the Kafka brokers, and that the DNS records are updated to point to the correct static IPs.
You will then need to update values-usdfprod-prompt-processing.yaml:
alert-stream-broker:
  cluster:
    name: "alert-broker"

  kafka:
    # Addresses based on the state as of 2023; these were assigned by
    # Square and now we're pinning them.
    externalListener:
      tls:
        enabled: false
      bootstrap:
        host: usdf-alert-stream-dev.lsst.cloud
        ip: "134.79.23.185"
        annotations:
          metallb.universe.tf/address-pool: 'sdf-dmz'
      brokers:
        - host: usdf-alert-stream-dev-broker-0.lsst.cloud
          ip: "134.79.23.214"
          broker: 6
          annotations:
            metallb.universe.tf/address-pool: 'sdf-dmz'
        - host: usdf-alert-stream-dev-broker-1.lsst.cloud
          ip: "134.79.23.216"
          broker: 7
          annotations:
            metallb.universe.tf/address-pool: 'sdf-dmz'
        - host: usdf-alert-stream-dev-broker-2.lsst.cloud
          ip: "134.79.23.218"
          broker: 8
          annotations:
            metallb.universe.tf/address-pool: 'sdf-dmz'
        - host: usdf-alert-stream-dev-broker-3.lsst.cloud
          ip: "134.79.23.220"
          broker: 9
          annotations:
            metallb.universe.tf/address-pool: 'sdf-dmz'
        - host: usdf-alert-stream-dev-broker-4.lsst.cloud
          ip: "134.79.23.217"
          broker: 10
          annotations:
            metallb.universe.tf/address-pool: 'sdf-dmz'
        - host: usdf-alert-stream-dev-broker-5.lsst.cloud
          ip: "134.79.23.219"
          broker: 11
          annotations:
            metallb.universe.tf/address-pool: 'sdf-dmz'
The Kafka brokers MUST point to static IPs, as restarting Kafka will otherwise result in the assigned IP’s to change. If they do not, there will be problems with the SSL certificates and he users will not be able to connect. See the following link for an explanation on why:
https://strimzi.io/blog/2021/05/07/deploying-kafka-with-lets-encrypt-certificates/
If the pods have been deleted and re-starting them results in new IP’s being automatically assigned or you see the following error, the previous pods were not deleted and may be orphaned. If you cannot see them via kubectl, you must get in contact with a kubernetes admin and have them delete the service. This may look like the following:
Failed to allocate IP for "alert-stream-broker/alert-broker-kafka-8": can't change sharing key for "alert-stream-broker/alert-broker-kafka-8",
address also in use by vcluster--usdf-alert-stream-broker-dev/alert-broker-kafka-2-x-alert-stream-broker-x-vcluste-90c3cd7783
Previous DNS provisioning workflow#
To provision the Kafka broker IPs, we will use kubectl to look up the IP addresses provisioned for the broker (see Getting kubectl Access for USDF).
Run kubectl get service --namespace sasquatch to get a list of all the services running:
-> % kubectl get service  -n sasquatch
NAME                                    TYPE           CLUSTER-IP       EXTERNAL-IP     PORT(S)                               AGE
alert-broker-kafka-10                   LoadBalancer   10.108.207.210   134.79.23.217   9094:31234/TCP                                 24h
alert-broker-kafka-11                   LoadBalancer   10.97.120.2      134.79.23.219   9094:31858/TCP                                 24h
alert-broker-kafka-6                    LoadBalancer   10.96.28.225     134.79.23.214   9094:30302/TCP                                 24h
alert-broker-kafka-7                    LoadBalancer   10.108.145.98    134.79.23.216   9094:30747/TCP                                 24h
alert-broker-kafka-8                    LoadBalancer   10.108.169.180   134.79.23.218   9094:31850/TCP                                 24h
alert-broker-kafka-9                    LoadBalancer   10.101.139.74    134.79.23.220   9094:32476/TCP                                 24h
alert-broker-kafka-bootstrap            ClusterIP      10.99.56.206     <none>          9091/TCP,9092/TCP,9093/TCP                     24h
alert-broker-kafka-brokers              ClusterIP      None             <none>          9090/TCP,9091/TCP,8443/TCP,9092/TCP,9093/TCP   24h
alert-broker-kafka-external-bootstrap   LoadBalancer   10.111.167.245   134.79.23.185   9094:30280/TCP                                 24h
alert-schema-registry                   ClusterIP      10.104.135.221   <none>          8081/TCP                                       23h
alert-stream-broker-alert-database      ClusterIP      10.99.69.201     <none>          3000/TCP                                       23h                            49d
The important column here is “EXTERNAL-IP.” Use it to discover the IP addresses for each of the individual broker hosts, and for the “external-bootstrap” service. Request DNS A records that map useful hostnames to these IP addresses - this is done by the SQuARE team, so you’ll need help.
Once you have DNS provisioned, make another change to values-<environment>.yaml to lock in the IP addresses and inform Kafka of the hostnames to use.
At USDF, we use values-usdfdev-prompt-processing.yaml.
Apply this change as usual (see Deploying a change with Argo). Now the broker should be accessible.
Adding users#
Make new user credential sets in 1Password for the new targeted environment. See Adding a new user account for how to do this.
In addition, make a user named ‘kafka-admin’ in 1Password in the same way.
Make sure to use the right value for the environment field of the 1Password items.
Then, set alert-stream-broker.vaultSecretsPath in values-<environment>.yaml to secret/k8s_oeprator/<environment>/alert-stream-broker. This will configure the Vault Secrets Operator to correctly feed secrets through.
If you need to manually set the credentials, this can be done via command line vault access at USDF.
Lingering issues#
You may need to re-sync several times to trigger the data-loading job of the alert stream simulator. When the system is in its half-broken state, this job will fail, and it can exponentially back-off which can take a very long time to recover. It can also hit a max retry limit and stop attempting to load data.
Using Argo to “sync” will kick it off again, which may fix the problem.
Deploying on a new Kubernetes cluster#
Deploying to a new Kubernetes cluster at USDF will require all the same steps as described in the previous section, but with a few additional wrinkles.
First, the strimzi-kafka chart uses the “load balancer” service type to provide external internet access to the Kafka nodes. Load balancer services are very platform-specific; on Google it corresponds to creation of TCP Load Balancers. On a non-Google platform, it might work very differently.
One option would be to use the targeted platform’s load balancers. Another option is to use Node Ports or Ingresses instead. The 5-part Strimzi blog post series “Accessing Kafka” goes into detail about these options.
Second, the alert database uses AWS S3 Storage buckets to store raw alert and schema data.
The requirements are made clear in the storage.py files of the github.com/lsst-dm/alert_database_ingester and github.com/lsst-dm/alert_database_server repositories.
An implementation would need to fulfill the abstract interface provided in that file.
There may be more requirements, but there certainly needs to be an investigation if you’re planning to move to a different Kubernetes provider.
Changing the schema registry hostname#
The Schema Registry’s hostname is controlled by the ‘hostname’ value passed in to charts/schema-registry. Updating that will update the hostname expected by the service.
In addition, a new DNS record will need to be created by whoever is provisioning DNS for the target environment. For the USDF environment, that’s SQuARE. It should route the new hostname to the ingress IP address.
Finally, the new schema registry needs to be passed in to the alert database in its ingester.schemaRegistryURL value.
See also: Changing the schema registry hostname.
Changing the Kafka broker hostnames#
Kafka broker hostnames can be changed by modifying the values passed in to charts/strimzi-kafka. Once changed, the broker will not work until DNS records are also updated.
See also: Provisioning DNS records.
Changing the alert database URL#
The alert database’s URL is based off of that of the cluster’s main Gafaelfawr ingress, so it cannot be changed entirely. However, it uses a path prefix, which can be changed. This path prefix is controlled by a value passed in to the alert database chart.
Changing the Kafka hardware#
Kafka hardware is managed by other administrators at USDF. If any changes need to be made, please make requests on the usdf-infra-support slack channel.
If you are hosting an alert stream service locally, the following is relevant information.
To change the hardware used by Kafka, change the nodes used in the node pool. This is set in the terraform configuration in environment/deployments/science-platform/env/integration-gke.tfvars:
{
  name = "kafka-pool"
  machine_type = "n2-standard-32"
  node_locations     = "us-central1-b"
  local_ssd_count    = 0
  auto_repair        = true
  auto_upgrade       = true
  preemptible        = false
  image_type         = "cos_containerd"
  enable_secure_boot = true
  disk_size_gb       = "500"
  disk_type          = "pd-standard"
  autoscaling        = true
  initial_node_count = 1
  min_count          = 1
  max_count          = 10
}
Change this, and apply the terraform change.
This may cause some downtime as the kafka nodes are terminated and replaced with new ones, evicting the Kafka brokers, but this isn’t known for certain.
Troubleshooting#
If all of the brokers have failed but everything else is running, the brokers may be out of storage. This means that Kafka needs to have either the storage allotted or the retention limits adjusted. This requires a restart of the brokers, and may require a full re-deployment of the whole system.
If you are fully restarting the Alert Broker, you may need to comment out the external load balancer and broker IP’s.
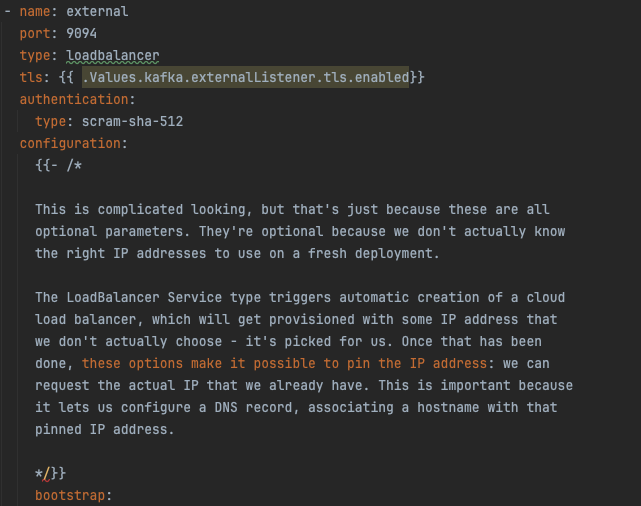
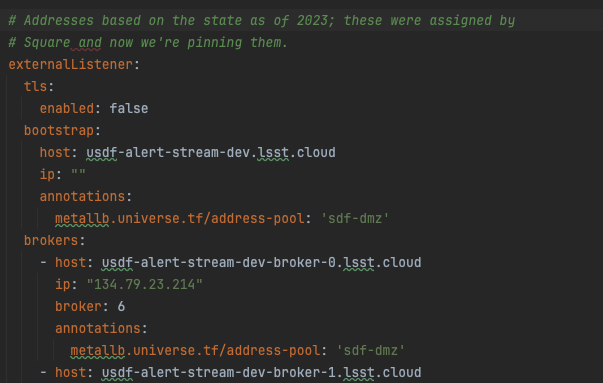
Comment out all of the code starting from the lines pictured below through the rest of the code block. This needs
to be done in both the kafka.yaml template and values-usdfdev-prompt-processing.yaml. Once the pods are up and running, uncomment the code so that
the external bootstrap starts up and the IP’s are properly assigned to the pods.
If you try and restart the brokers from a fail state (whether they have run out of storage or not), and they end up in crashback loops, make sure to delete their persistent volume claims to ensure that they can rebuild.
If, during deployment, any resource begins to error continuously, you can delete that specific resource while troubleshooting. This prevents the status channel from being continuously spammed with errors. It is recommended to grab the error log first from the logs tab first before deleting the resources.
If you are attempting to delete the topics and they are stuck deleting, you need to remove the finalizers from the topics to allow them to be deleted. This is done via the following command.
kubectl patch kafkatopics.kafka.strimzi.io TOPIC-NAME --namespace sasquatch -p '{"metadata":{"finalizers": []}}' --type=merge
Replace TOPIC-NAME with the stuck topics.
If a pod is stuck terminating, check the pod’s status:
kubectl get pods -n sasquatch
If it says termination is pending, use the following command to forcibly delete the pod.
kubectl delete pod alert-broker-controller-3 --grace-period=0 --force --namespace sasquatch
If it is not starting back up correctly, and you are stuck with a pod that won’t build and won’t delete, try the above command again. If it persists, ask for help from USDF.
If for some reason the instance of sasquatch has been removed from the active applications, you can re-deploy it by going to the sasquatch application in ArgoCD and re-syncing.
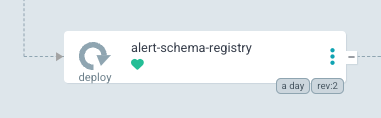
If the sync-schema job is failing, this may be related to several issues. If the sasquatch application has been completely rebuilt from scratch, then the schema registry may not be fully set up. Check that the schema registry looks like this:
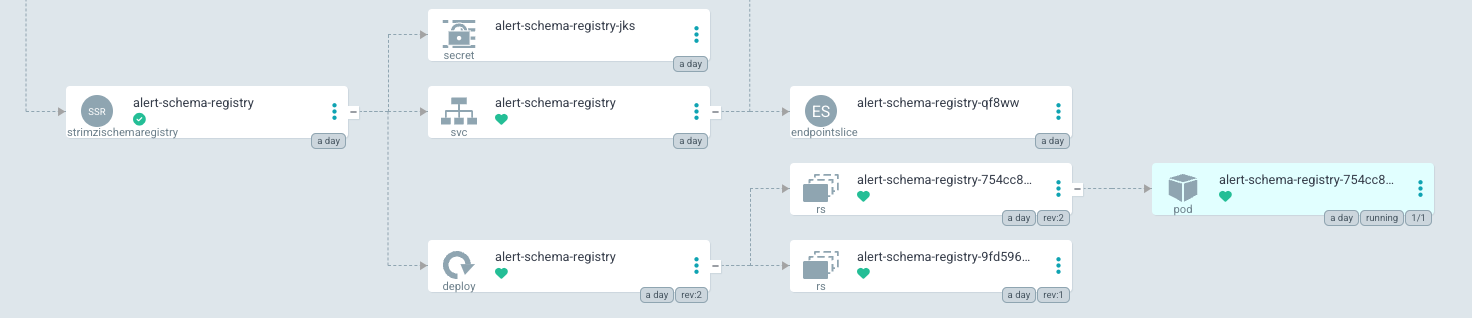
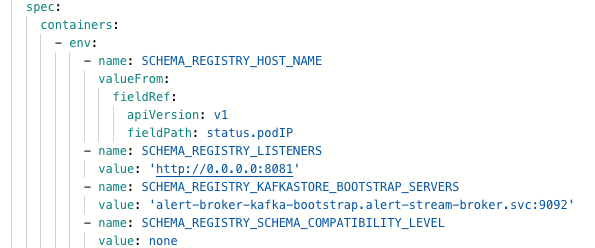
If it does not, follow the steps listed above. The sync schema job will still fail after this, as the alert-schema-registry application currently defaults to forward compatibility. This will need to be changed to none.
If you receive any errors that a service already exists or resources are being used by an existing service, and you cannot see that service or resource from argocd or kubectl, then the service or resource may not be accessible. The service/resource may still exist but needs to be manually deleted by a kubernetes administrator.
Additionally, if resources or services are stuck or not deploying and there are no errors or the services does not produce a log, you can check the strimzi operator pod within the strimzi application in argo. There may be additional log information there.
References#
Argo CD: Declarative GitOps CD for Kubernetes. URL: https://argo-cd.readthedocs.io/en/stable/.
Spencer Nelson and Brianna M. Smart. Implementation of the LSST Alert Distribution System. Data Management Technical Note DMTN-210, NSF-DOE Vera C. Rubin Observatory, July 2025. URL: https://dmtn-210.lsst.io/.